Guide data mapped choices at the Van Gogh Museum
The model predicted 63% of next transitions. The logs recorded neither gaze, dwell time nor continuous visitor position.
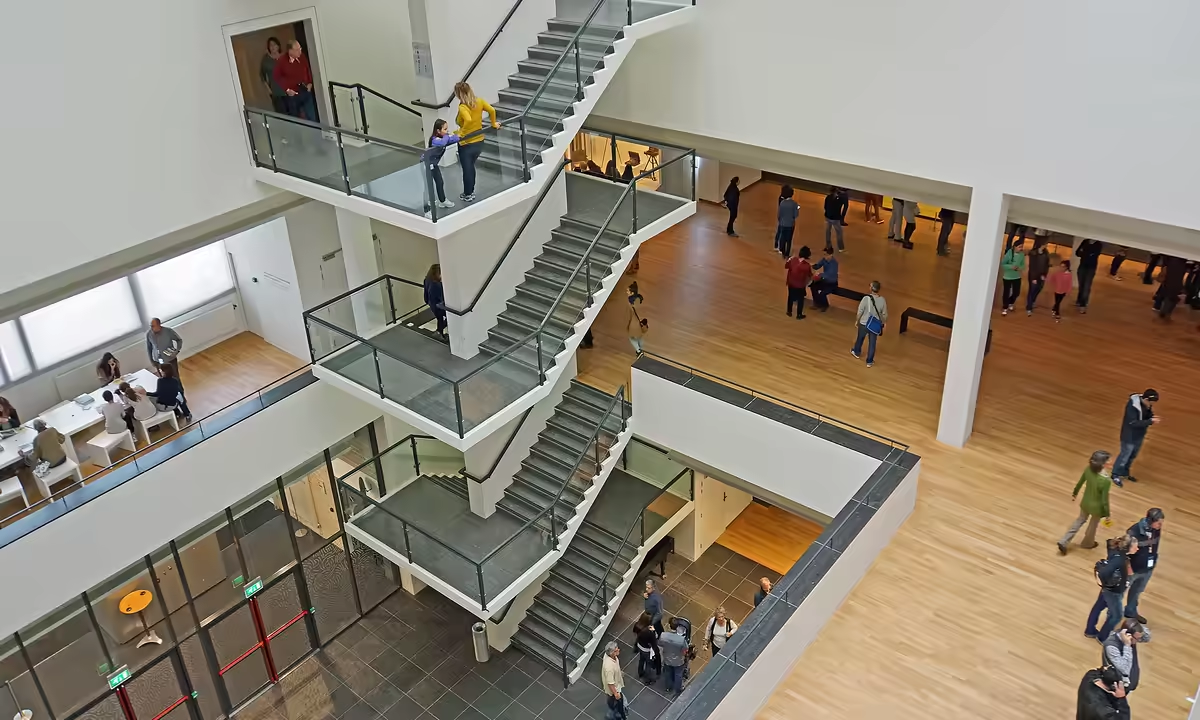
The April 2026 issue of Management Science published a model that predicted 63% of the next transitions recorded by multimedia guides at Amsterdam’s Van Gogh Museum. That score concerns one decision at a time: the content a visitor would select next, or whether the visit would end. It is not a measure of an entire journey’s accuracy.¹
The researchers connected click sequences with the positions of artworks and the organisation of the guide interface. Greater distances inside the building and more effort to find an option on screen were associated with a lower chance of moving to that item. The underlying record stops at the guide: it captured content selections without observing gaze, dwell time or a person’s continuous movement through the galleries.² ⁴
The record began with a tap on the guide
The device offered tracks for 45 artworks in 11 languages. A highlights tour used a list, while a broader leisure tour placed options on a circular interface. Availability changed with the display; the full working paper reports an average of 28 artworks on the guide during the period it describes.²
A session generated a clickstream containing the order of selections, the start and end of a track, segment completion, tour type and language. The researchers joined those events to a record of where each artwork was hanging at the time. When two tracks occurred in succession, the model could attach the distance between the corresponding locations under that day’s layout.²
This process produces a coarse reconstruction. The logs contained no real-time coordinates, wearable sensor feed or eye tracking. A track’s active interval also cannot establish how long someone stood before a painting. A selection is evidence of interaction with guide content; the physical route between selections remains inferred.² ⁴
Guide users form a selective group. In the distribution by day, 25% and 31% were respectively the 25th and 75th percentiles of the share of visitors using the service, according to the working paper. Earlier museum surveys found higher take-up among people visiting with children and among visitors from outside the Netherlands. The observed sequences therefore cannot be assumed to represent everyone who entered the building.²
Raw logs and modelling samples sit at different scales
INFORMS describes anonymised records from more than 1.5 million visits between 2019 and 2021.³ The detailed working paper identifies 715,000 distinct visits in 2019 as its main analytical data set. The team then drew 25,000 visitors at random from September and October to estimate the model under a stable layout. A separate group of 25,000 visitors from the same period served as the out-of-sample test.²
Each figure answers a separate question. More than 1.5 million describes the log universe available to the project. The 715,000 visits define the main 2019 data set. In the 2023 working paper, the 63% result was measured with the estimation and test groups of 25,000 rather than one regression across every session. The published version retains the metric, but its official abstract does not repeat those subsample sizes.¹ ² ³
September and October 2019 also predate pandemic restrictions. The arrangement of artworks remained stable while the main specification was estimated. The researchers report repeating the analysis across four other periods in 2019 and obtaining similar findings.²
Pathway MNL assigns a probability to the next choice
The pathway multinomial logit treats each visit as a chain of conditional decisions. Following a click, the options consist of artworks not yet selected and an outside option that ends the path. The probability of each alternative depends on the current point and the context of that session.¹ ²
Physical variables include distance, room changes and floor changes. The digital layer measures how far a person needs to move through a list or wheel and whether another tour mode must be opened. Artwork attributes and controls for language, weekday and time of day complete the specification. The number of works already selected acts as a marker of how far the visit has progressed.²
On visitors excluded from estimation, the main model correctly classified 63% of next transitions. A specification without layout factors reached 23%, while a specification whose only layout factor was the nearest-artwork indicator reached about 49%. A visitor faced roughly 11 choices at each transition on average.² The comparison shows how spatial and interface variables improve this particular prediction. It does not turn the percentage into a reading of a person’s whole museum experience.
Distance and congestion remain associations
The estimates link greater physical separation to a lower tendency to move from one artwork to another. The interface follows the same pattern: options farther from the current selection in the list or wheel and content placed in another tour mode received fewer transitions.¹ ² The model controls for artwork preferences and several contextual features, although it cannot absorb every individual plan, companion, mobility constraint or intention formed before arrival.
Congestion was approximated by the number of people beginning their visits around the same time. Higher levels were associated with more guide interactions, including selections of less prominent artworks.¹ ² That proxy does not count the crowd around each painting. Nor does it establish that a busier building caused exploration. Queues could redirect attention to nearby works, while busy time slots could attract visitors with different habits. The published paper describes correlations rather than causal effects.¹
Temporary moves tested predictions under new layouts
Construction and maintenance temporarily relocated four sets of paintings in November and December 2019. The researchers compared predicted changes in transition rates with the logs produced when works including Sunflowers and The Potato Eaters moved to a different floor. The relocations had operational reasons and were not announced to incoming visitors.²
These episodes tested the model beyond the layout used for estimation. They still lacked a simultaneous control group because every visitor encountered the change. The analysis built a reference from weekly seasonality and an autoregressive model. Its results support predictive performance across several temporary arrangements, without making every estimated relationship causal.²
The researchers then posed a distinct optimisation problem. Their algorithm simulated assignments of artworks to locations with the objective of maximising the expected number of guide selections. The counterfactual arrangements were not installed as a definitive plan for the collection.¹ ²
Click-path length is a narrow operational objective. Curatorial narrative, conservation requirements, accessibility and safety lie outside its mathematical function. The authors present modelling as a complement to curatorial knowledge.⁴ Predicted changes in transitions can become one input into a display decision while those other purposes remain with the museum’s staff.
Sources
- Designing Layouts for Sequential Experiences: Application to Cultural Institutions · Management Science 72(4) · https://doi.org/10.1287/mnsc.2022.02024 · published online 25 Aug. 2025; April 2026 issue
- Designing Layouts for Sequential Experiences: Application to Cultural Institutions (full working paper; data, estimation and validations) · Aouad, Deshmane and Martínez-de-Albéniz · https://blog.iese.edu/martinezdealbeniz/files/2023/05/20230525_Designing_Layouts_small.pdf · 25 May 2023
Show 2 more sourcesHide sources
- New Research Shows Museum Design Quietly Determines What Visitors See and What They Miss · INFORMS · https://www.informs.org/News-Room/INFORMS-Releases/News-Releases/New-Research-Shows-Museum-Design-Quietly-Determines-What-Visitors-See-and-What-They-Miss · 14 Jan. 2026
- Design insights from studying the Van Gogh Museum · MIT Sloan · https://mitsloan.mit.edu/ideas-made-to-matter/design-insights-studying-van-gogh-museum · 10 Feb. 2026